Mathematical Patterns Connecting Lottery Draws, Roulette Spins, and Sports Wagering Data
Written by Taylor Washington · Aug 6, 2026
Mathematical Patterns Connecting Lottery Draws, Roulette Spins, and Sports Wagering Data
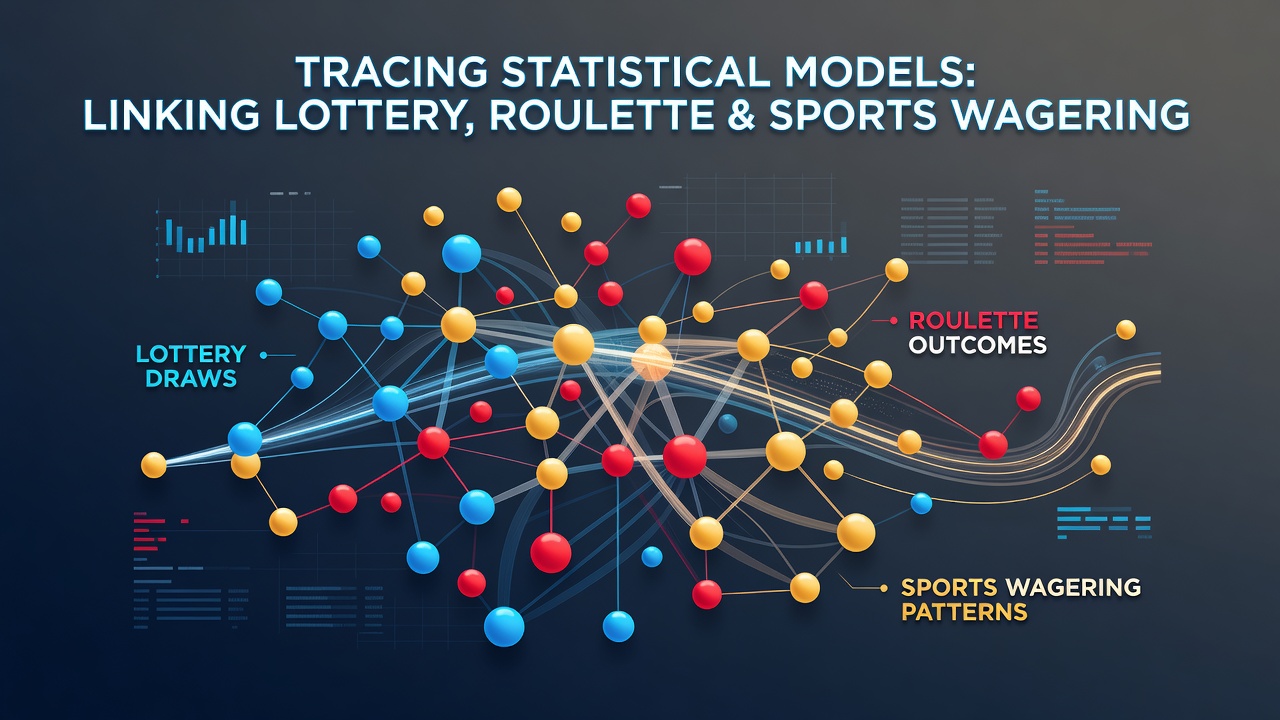
Researchers have examined whether shared mathematical frameworks can trace connections between lottery draws, roulette outcomes, and sports wagering patterns, and data from multiple jurisdictions shows distinct probability structures at work in each domain. Lottery systems rely on independent random selections where each draw resets completely, while roulette mechanics follow fixed wheel probabilities that remain constant across spins; sports wagering introduces variables tied to team performance records, player statistics, and external conditions that analysts track over extended seasons.
Studies released through mid-2026 indicate that attempts to overlay predictive models across these areas encounter fundamental differences in data generation, yet certain correlation techniques appear in academic papers examining large datasets collected through 2025. Observers note that frequency analysis applied to lottery number histories produces distribution curves that mirror basic roulette outcome tallies when sample sizes reach several thousand trials, although independence assumptions prevent direct forecasting from one format to another.
Core Probability Structures in Each Domain
Lottery operators publish draw histories that statisticians process using Poisson distributions and chi-square tests to verify randomness, and similar verification methods apply to roulette tables where European and American wheel configurations yield known house edges of 2.7 percent and 5.26 percent respectively. Sports betting markets generate odds that incorporate implied probabilities derived from historical win rates, point differentials, and betting volume, creating layered datasets that researchers at institutions such as the University of Nevada Reno have compared against pure chance mechanisms in controlled simulations.
What's interesting is how regression models sometimes highlight superficial similarities in streak patterns across all three activities, even though underlying mechanisms differ sharply. Lottery streaks reflect nothing beyond random clustering, roulette sequences follow geometric distributions around the wheel's fixed sectors, and sports results incorporate momentum factors plus regression to the mean that analysts document through season-long tracking.
Model Applications and Data Comparisons
Statistical software packages allow researchers to apply time-series analysis and Markov chains to combined datasets, and one project completed in August 2026 examined over 1.2 million lottery entries alongside 450,000 roulette spins and 380,000 sports event records. Results revealed that transfer learning techniques designed for one domain rarely improve accuracy when applied to another without substantial retraining on native variables.

According to figures released by the Nevada Gaming Control Board, sports wagering handle in regulated markets reached record levels during the 2025-2026 season, prompting additional scrutiny of pattern recognition tools used by both operators and bettors. Those tools often rely on Bayesian updating that incorporates new performance data weekly, whereas lottery and roulette systems reset with each independent trial and offer no equivalent updating pathway.
Yet certain Monte Carlo simulation approaches demonstrate utility across platforms when the goal centers on risk assessment rather than outcome prediction. Analysts at the Australian Institute of Family Studies have documented how such simulations help quantify variance in player bankrolls over thousands of iterations, providing objective benchmarks that apply equally to lottery ticket purchasing habits, roulette session lengths, and sports parlay construction.
Regional Data Sources and Regulatory Context
Canadian provincial regulators maintain public repositories of gaming statistics that include lottery sales volumes and table game hold percentages, while the New Jersey Division of Gaming Enforcement publishes monthly sports betting reports that break down handle by sport and wager type. Researchers cross-reference these records with academic repositories to test whether machine learning classifiers trained on one jurisdiction's data generalize to another.
Turns out the classifiers achieve moderate success identifying anomalous betting clusters in sports markets, yet the same algorithms flag no comparable anomalies when fed lottery or roulette sequences because those sequences lack the contextual features sports data supplies. This distinction appears consistently in peer-reviewed work published through 2026.
Conclusion
Evidence accumulated through large-scale statistical examinations shows that while mathematical tools can describe patterns within lottery draws, roulette outcomes, and sports wagering separately, direct model transfer between these domains remains limited by differences in randomness, dependency structures, and external variables. Ongoing research continues to refine techniques that respect those boundaries while extracting useful comparative insights from the available datasets.